I have successfully used HoG for a number of object recognition tasks. In fact I have found it to be a ridiculously good image descriptor particularly for rigid bodies. It can easily differentiate between various objects given very few training samples and is much faster than any of the existing object detection algorithms. While I know the current trend among researchers is toward CNNs, I also feel that CNNs are quite computationally expensive and require extensive training as opposed to HoGs which can be easily implemented on embedded devices.
One of the major problems with HoG though is that HoG is not rotation invariant. The naïve way of solving this problem is by shifting the histogram bins one by one then measuring the distance between bins. Naturally, this is a very expensive process on a large scale. The time complexity of this would be 
The task of shifting the histogram bin by bin smelled awfully like correlation – in fact it is correlation. One of the cool properties of correlation is that it has a nice mathematical property:
Let 


So lets try it.
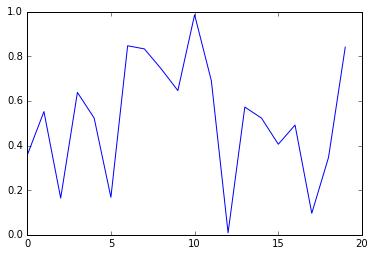
I generated a random histogram:
import matplotlib
import matplotlib.pyplot as plt
import numpy as np
%matplotlib inline
arr = np.random.rand(20)
plt.plot(arr)
plt.show()

Next I wrote a shift function:
def shift_array(array,quantity):
     shifted_array = [0.0]*len(array)
     i = 0
     while i < len(array):
         shifted_array[i-quantity] = array[i]
          i+=1
     return shifted_array
arr_shifted = shift_array(arr,3)
plt.plot(arr_shifted)
plt.show()
Now lets try the trick:
arr1 = np.fft.rfft(arr)
arr2 = np.fft.rfft(arr_shifted)
output = np.fft.irfft(np.conj(arr1)*arr2)
plt.plot(output)
plt.show()
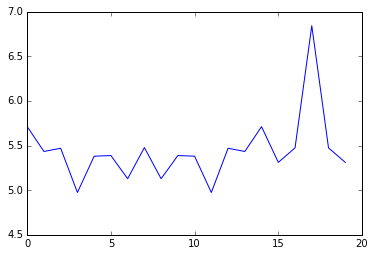
Lets try on arr_shifted:
arr_shifted2 = shift_array(arr,9)
arr1 = np.fft.rfft(arr)
arr2 = np.fft.rfft(arr_shifted2)
output2 = np.fft.irfft(np.conj(arr1)*arr2)
plt.plot(output2)
plt.show()

Notice the peak shifted! This could well tell us how much shift there is. Lets check to see:
print(20-np.argmax(output2))
print(20-np.argmax(output))
This gives us peaks at 9 and 3. Exactly the amount we shifted!
But how about comparison? While we can determine the angle of best fit, how do we know whether its actually a fit? Lets take a look:
arr_diff = np.random.rand(20)
arr1 = np.fft.rfft(arr)
arr2 = np.fft.rfft(arr_diff)
output2 = np.fft.irfft(np.conj(arr1)*arr2)
plt.plot(output2)
plt.show()

Notice how there is no clear peak. One could use simple mean and stdev to show that there is no strong peak. This would in effect give us an estimate for how strongly correlated the values are.
